
Generalised Management Strategy Evaluation
As part of the ConFooBio project at the
University of Stirling, my
colleagues and I have released the
new R package GMSE, with
v0.2.2.7 currently available on
CRAN and
GitHub. The GMSE package
generalises management strategy
evaluation
(MSE), an adaptive management framework that incorporates
social-ecological system dynamics, the process of observing and
monitoring the social-ecological system, and the assessment and
decision-making processes of managers (Bunnefeld, Hoshino, and
Milner-Gulland 2011). Our generalisation includes a game-theoretic
component in which both managers and stakeholders dynamically update
their decision-making to maximise their own utilities. The GMSE package
thereby simulates all aspects of MSE and uses genetic algorithms
(Hamblin 2013) to find adaptive solutions for manager and stakeholder
decision-making.
![]()
In keeping with the MSE approach (Bunnefeld, Hoshino, and Milner-Gulland
2011), GMSE does not attempt to find optimal strategies or solutions for
management. Instead, genetic
algorithms within the
GMSE package find manager policies and stakeholder actions that are
adaptive, meaning that policies and actions that are found reflect
heuristic strategies of managers and stakeholders that are adopted
within a set of constraints and potentially changing circumstances. A
wide range of parameter values can be specified by the software user to
simulate management (for a full list, see the available arguments to the
gmse() function in the reference
manual, or run
help(gmse) after loading the GMSE package). The gmse() function
simulates all aspects of management, including the natural resources
(population) model, the process by which resources are sampled or
observed, the process by which managers make decisions about policy, and
the process by which stakeholders decide how to act in response to
policy (see Figure 1 below). The latter two processes (upper
left and right boxes in Figure 1, respectively) each call the
genetic algorithm to find adaptive solutions in each time step.
Figure 1: General overview of GMSE
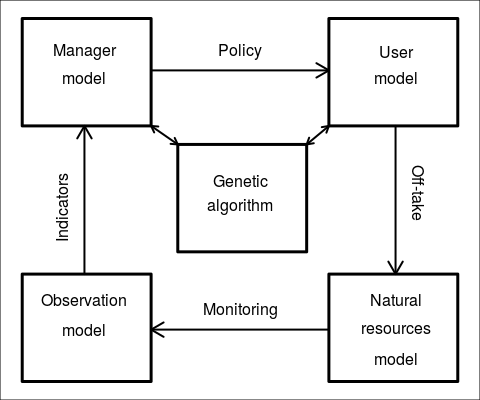
All sub-models (boxes in Figure 1) are individual-based (i.e., agent-based). The natural resources model simulates a single time step of resources (e.g., a managed population) that can undergo movement, reproduction, and death. The observation model simulates the monitoring of the resources (e.g., through capture-mark-recapture techniques). The manager model uses data from the observation model to set policy for stakeholders (e.g., how costly culling, scaring, or feeding resources should be), and the user model uses manager policy to determine actions to maximise their own utilities.
Installing the GMSE package
The GMSE package can be installed from CRAN or GitHub. The easiest way
to install is through CRAN using the install.packages function in R
(Note, R version 3.3.3 or higher is required for GMSE).
install.packages("GMSE")
To install this package from GitHub, the devtools library first needs
to be installed.
install.packages("devtools")
library(devtools)
Use install_github to install using devtools.
install_github("bradduthie/GMSE")
A simple example illustrates the use of GMSE below.
A hunted population under management
Consider a population of managed resources that is hunted by four
stakeholders (GMSE allows for any number of stakeholders; the default
number is four to keep things simple). Assume that the population has a
carrying capacity of res_death_K = 600 adults, and the manager wants
to keep the population at manage_target = 400 individuals. The manager
will use a capture-mark-recapture method of monitoring the population in
each time step (observe_type = 1). Further assume that all other
parameter values are set to default values (see the reference
manual). We can
run this scenario using the code below.
sim <- gmse(observe_type = 1, manage_target = 400, res_death_K = 600, plotting = FALSE);

## [1] "Initialising simulations ... "
## [1] "Generation  33 of  100"
## [1] "Generation  62 of  100"
## [1] "Generation  95 of  100"
To avoid automatic plotting, I have set plotting = FALSE. The output
to sim is a very large data structure that includes output from each
sub-model (natural resource, observation, manager, and user) in each of
100 (default) time steps. The results can be plotted using the
plot_gmse_results function.
plot_gmse_results(res = sim$resource, obs = sim$observation, land = sim$land,
                  agents = sim$agents, paras = sim$paras, ACTION = sim$action,
                  COST = sim$cost);

Figure 2: Example of plotted GMSE simulation results.
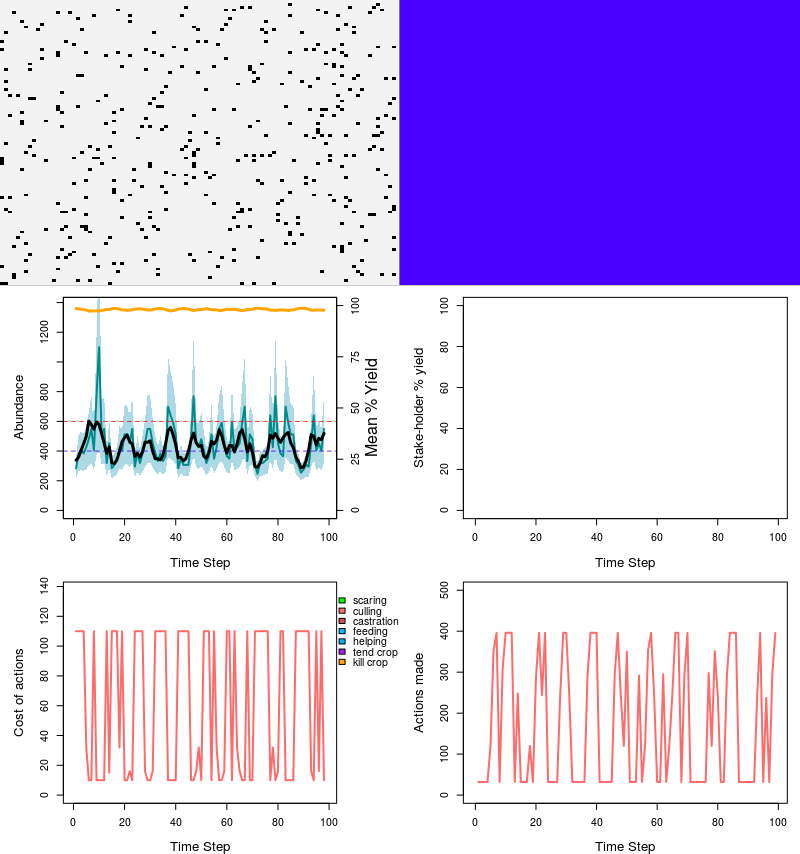
Figure 2 above shows the simulation dynamics over time for the
starting parameter values set in sim. The upper left panel of the plot
shows the positions of resources on the simulated landscape in the last
time step (had we set plotting = TRUE, the movement of resources over
time would be observable). The upper right panel is entirely blue,
representing public land that is not owned by stakeholders (to simulate
stakeholders that own land and attempt to maximise land values – e.g.,
crop yield –, use the option land_ownership = TRUE. Land ownership
will then be represented by different landscape colours).
The middle left plot shows how both actual and estimated resource
abundance changes over time. The solid black line illustrates the actual
abundance of resources (i.e., the number of individuals) alive in each
time step; the solid blue line illustrates how many resources are
estimated based on the observation model and the simulated
mark-recapture technique of the manager (blue shading illustrates 95
percent confidence intervals, but these are for display only and are not
used in manager decision-making). The black dotted line identifies the
management target (manage_target = 400), and the red dotted line
illustrates the population carrying capacity (res_death_K = 600); note
that carrying capacity is enacted on adult mortality (but see also
res_birth_K), so abundance can increase over carrying capacity given a
sufficient number of juvenile and adult resources (where juveniles are
defined as individuals born in the same time step as the current time
step). The orange line shows the mean percent yield (right axis) of
landscape production, which may be decreased by resources if resources
consume crops on the landscape (see res_consume). The middle right
panel would show the percent yield of each individual stakeholder’s
given land_ownership = TRUE, with solid line colours reflecting yield
from identically coloured plots in the upper right panel.
The lower left and right plots show manager policy and stakeholder
actions over time, respectively. Under default simulation parameter
values, only culling is available as a management policy and a
stakeholder action, but (as indicated by the legend) other policy
options can be set, including any combination of the following: scaring
(moving resources), culling (killing resources), castration (removing
resource’s ability to reproduce), feeding (increasing a resource’s
survival probability), helping (increasing a resource’s reproduction),
tend crop (increasing the yield from landscape cells), and kill crop
(destroying yield of a landscape cell). Managers create policy by
setting the cost of stakeholders performing available actions on
resources (i.e., all actions except tending and killing crops), as
constrained by the manger’s budget (manager_budget) and a minimum cost
of performing actions (minimum_cost). In the above plot, there are
time steps in which the manager has set culling costs to be high or low,
based on the degree to which the estimated abundance of the population
(blue line in middle left panel) is above or below the manager’s target.
In response, stakeholders (in this case hunters) cull a lot when the
manager sets culling to be cheap, but very little when culling costs are
set to be high (‘costs’ in this case might be interpreted as quotas, or
as strongly enforced prohibitions if the cost of culling is higher than
the stakeholders budget, user_budget).
The gmse() function thereby provides a method of simulating multiple
aspects of population management. This simple example is only one of
many possible scenarios that can be simulated.
Development of GMSE
The code underlying GMSE has been
flexibly developed for future expansion and new features. If there is
something that would be useful to add that does not appear to be
available by setting parameter values in gmse(), then chances are it
can already be done by a few tweaks to the source code, or would require
only a bit of additional coding. For example, the code already allows
for future expansions to any number of resource types, allowing for
multiple populations and structured populations – this is also true for
agents.
A wiki can be found in the GMSE GitHub repository, and there is a place to post issues, including suggestions for new features.
![]()
References
Bunnefeld, Nils, Eriko Hoshino, and Eleanor J Milner-Gulland. 2011. “Management strategy evaluation: A powerful tool for conservation?” Trends in Ecology and Evolution 26 (9): 441–47. doi:10.1016/j.tree.2011.05.003.
Hamblin, Steven. 2013. “On the practical usage of genetic algorithms in ecology and evolution.” Methods in Ecology and Evolution 4 (2): 184–94. doi:10.1111/2041-210X.12000.